Why DO% Excursions Are the Most Misclassified Deviation in Fed-Batch Culture
Dissolved oxygen sits at the intersection of every major subsystem in a bioreactor. Aeration rate, agitation speed, sparger condition, culture metabolism, temperature, and media oxygen demand all directly influence the DO% value measured by the polarographic or optical probe. When DO% drifts outside its control range — say, below 30% saturation in a CHO fed-batch process running a setpoint of 40% — the DCS alarm fires with no intrinsic information about which subsystem caused the fault.
The misclassification pattern that appears most often in practice is this: the first person to respond to the alarm sees agitation RPM at setpoint and draws the inference that agitation is fine, then attributes the excursion to "culture metabolic shift" without reviewing the gas supply data. This classification persists into the formal deviation record because it aligns with an intuitive narrative — the culture was growing faster than expected. The CAPA addresses feed strategy. The real cause, in a significant fraction of these cases, is a partially blocked sparger that the investigator did not check because sparger condition is not visible in the DCS historian.
This walkthrough describes the data correlation sequence that correctly isolates the cause. It is organized as a decision tree with explicit data checkpoints, intended for MSAT engineers writing the initial deviation record as well as QA reviewers evaluating investigation completeness.
Step 1: Establish the Baseline Window
Open a 72-hour trend view centered on the deviation event. The relevant tags at minimum are: DO% measured value, DO% setpoint, agitation RPM (measured and setpoint), air flow rate (SLPM), sparge air valve position, temperature (measured and setpoint), and pH measured value. If your DCS historian is OSIsoft PI or AVEVA PI, a prepared tag group for this parameter family eliminates the time otherwise spent navigating to individual tags.
Check whether the DO% decline is continuous and progressive (characteristic of sparger degradation or increasing OUR as culture density rises) or step-change abrupt (characteristic of equipment failure — agitation motor trip, valve misposition, probe failure). These two profiles require different investigation paths.
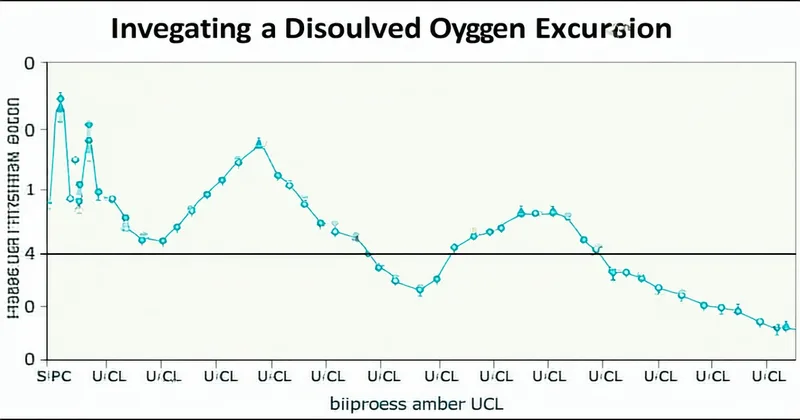
For batch MABP-2025-041, a 500L IgG fed-batch process at a Phase 2 vaccine candidate program, the DO% trend showed a progressive decline from 42% to 18% over 8 hours beginning at hour 30. No step changes. The agitation RPM trend showed stable tracking at 120 RPM ±3 throughout that window. This immediately de-prioritizes the agitation fault hypothesis and puts the investigation in gas transfer territory.
Step 2: Check Gas Supply Before Culture Metabolism
The most common sequence error in DO% investigation is moving directly from "RPM is fine" to "must be culture metabolism." Gas supply should always be checked before culture metabolism because it is the faster hypothesis to falsify: either the supply was interrupted or it was not.
The relevant data points are air flow rate SLPM (is the controller delivering what the setpoint calls for?), sparge valve position (did the valve partial-close due to a solenoid fault?), and compressed air header pressure upstream of the bioreactor. In a Sartorius BIOSTAT B-DCU setup, the mass flow controller output and the downstream pressure are both logged by the BIOSTAT DCS and can be exported directly. In setups where the compressed air supply is monitored by a facility BMS rather than the bioreactor DCS, pulling this data requires a cross-system historian query — which is where the delay typically happens in manual investigation workflows.
For batch MABP-2025-041, the air flow rate delivered to the bioreactor matched setpoint within 2% throughout the excursion window. Sparge valve position was 100% open. Compressed air header pressure was 1.1 bar, within the 0.8–1.5 bar operating range. Gas supply is closed as a cause.
Step 3: OUR Calculation and Growth Rate Cross-Reference
With gas supply ruled out, the next step is to calculate or retrieve OUR. Oxygen uptake rate (mmol/L/h) is either calculated directly from off-gas analysis (CER-based mass balance) or estimated from the air flow rate and DO% setpoint tracking data. Either method gives a comparable view of whether the culture's metabolic demand exceeded the bioreactor's delivery capacity.
Plot OUR against VCD (viable cell density) trend if VCD is measured by an in-line probe or at daily offline sampling points. In a well-characterized CHO mAb process, the OUR-to-VCD ratio should be fairly stable through the exponential growth phase — typically in the range of 0.08–0.15 mmol/10⁶ cells/h, depending on the cell line and process conditions. If OUR is rising faster than VCD would predict, you are looking at a metabolic perturbation — often linked to a feed addition event or a temperature shift that drove up specific oxygen consumption rate.
For batch MABP-2025-041, the OUR calculation showed a 35% step increase at hour 28 — two hours before the DO% began declining. VCD at the hour-28 offline sample was within 8% of the previous batch average at the same time point. The OUR increase was not explained by population size. This directed investigation toward the feed event that occurred at hour 27: an overdelivery of 12% on the glucose feed volume was identified in the pump calibration log. Elevated glucose drove increased culture respiration, which outpaced the aeration capacity of the bioreactor at its current agitation and air flow settings.
Step 4: Probe Condition as a Parallel Check
We are not saying probe failure is a rare cause — it is actually one of the most common sources of apparent DO% deviations. The distinction is that probe failure presents as a data artifact, not a true process event. The investigation should include a probe condition assessment in parallel with the gas supply and OUR checks: when was the probe last calibrated, what was the two-point calibration result, and was the probe response validated post-batch?
A drifting polarographic DO probe will show a measured value that declines or rises without corresponding changes in agitation response (the controller will attempt to compensate, increasing RPM or air flow, but the measured DO% will continue its drift). If the RPM and air flow trended upward in the excursion window while DO% continued declining, this is a red flag for probe drift rather than a true oxygen demand event — because a healthy culture responding to increased aeration would show at least partial DO% stabilization.
The probe condition check requires pulling the calibration record from the batch record system (Werum PAS-X or equivalent EBR platform) and comparing the in-process calibration date against the excursion window. If calibration was within 24 hours of the excursion and the two-point response showed an offset greater than 5% on the air-saturated reference, the probe is a candidate for recalibration-driven offset error.
Step 5: Sparger Physical Inspection
The gas supply is clean, OUR explains the metabolic context, probe calibration was recent — and the DO% still underperformed compared to historical batches at similar cell densities. This is where sparger condition needs to be assessed. Unlike the preceding checks, sparger inspection typically cannot happen in-process without interrupting the run. The inspection window is batch close or the next scheduled maintenance interval, which means sparger condition is retroactively confirmed rather than real-time verified.
Document the inspection methodology in the deviation record: what inspection criteria were applied, whether a pressure drop test across the sparger was performed before cleaning, and whether photographs were taken. If partial blockage is found — fouling in 2 or more of 8 ports on a standard sintered metal sparger — the finding needs to be linked back to the DO% excursion in the investigation conclusion, and the CAPA needs to address sparger inspection frequency within the cleaning validation cycle.
The Fermentile analytics platform maintains a sparger maintenance history cross-reference per bioreactor vessel, so when a DO% excursion fires, the system can immediately surface the last sparger inspection date and the delta since that inspection — reducing the time to include this data in the initial investigation record. This kind of data integration across historian and maintenance systems is what eliminates the manual data-gathering step that typically adds 3–5 hours to a deviation investigation cycle.
Common Misclassification Patterns and How They Compound
Three misclassification patterns appear with regularity in DO% excursion investigations. The first is attributing a feed-driven OUR increase to an unspecified "metabolic shift" without identifying the triggering event — the glucose overdelivery, the temperature perturbation, or the seed train quality issue that changed the metabolic state entering the production run. This classification is technically correct in that it identifies a metabolic cause but insufficient for CAPA because it does not identify the controllable upstream variable.
The second pattern is closing the sparger investigation branch too early because the measured air flow rate was nominal. Air flow at the bioreactor inlet does not confirm sparger distribution efficiency — only that the controller was commanding the right volume. A partially blocked sparger can show nominal inlet flow while dramatically reducing the oxygen transfer rate by shifting bubble size distribution and reducing interfacial area.
The third pattern is using probe condition as the default attribution when no other cause is confirmed. An uncharacterized probe drift finding can close an investigation that should have remained open. The correct posture: if probe drift is suspected, the investigation should include a post-batch probe test protocol, and the deviation should remain open until that data is available and reviewed.
The structured classification tree methodology described in our companion Field Report addresses all three of these patterns by enforcing explicit branch-exit criteria before a cause is accepted or closed.